A respondent abandons your survey at Q12. They don’t file a complaint. They just leave. You find out three weeks later, in the analysis, when one segment is thin and the completion curve drops at a point nobody flagged during design.
The immediate explanation is usually survey length. Maybe the questionnaire ran long or the timing was off. Or the particular panel doesn’t engage well with this category. These explanations are not wrong exactly. They are also not the full story.
Survey аbandonment that happens at a predictable point in a questionnaire is almost never random. It is the visible outcome of a structural problem that was already in the design when the questionnaire went to scripting. The respondent abandoned it at Q12 because they ran out of patience. Because the questionnaire put four consecutive grid questions between Q8 and Q12, presented on mobile, with no section break and no variation in task type. Their engagement did not run out. It was used up.
The distinction matters because one of these problems is fixable before scripting begins, and one is not.
The Difference Between a Clarity Problem and a Burden Problem
The previous article in this series covered survey question wording and the problems that come from individual questions a respondent cannot parse. A double-barreled item. An unanchored scale. Category jargon the audience does not share. Those are clarity problems. They operate at the level of the individual question: can the respondent understand what is being asked?
Respondent burden is a different category. A questionnaire can be written entirely in plain, accessible language and still drive high dropout rates or produce low-quality responses by question 15. The problem is not at the question level. It is at the journey level: can the respondent get through the survey without the experience itself burning through their willingness to engage?
Both produce survey abandonment. Both produce low-quality responses in data that look like valid answers. The root cause is different, and so is the fix.
A wording problem is corrected by rewriting the question. A burden problem is corrected by restructuring the respondent’s journey: cutting unnecessary grids, repositioning open ends, varying task types, building in section breaks, shortening paths where the routing allows. These are design decisions, not copyediting tasks. And they become very expensive once the survey has been scripted and is in field.
ResearchReady’s Respondent Experience panel exists precisely because a structured review of the respondent journey does not happen naturally during the questionnaire design process. The same expertise that makes a team good at designing the questionnaire makes them poorly placed to experience it the way a respondent will. That gap is where burden problems live.
What Survey Fatigue Looks Like in a Questionnaire
Survey fatigue is often described as a consequence of survey length. That framing is imprecise in a way that matters for design. Length is a proxy for the actual problem, which is cognitive load over time.
A 12-minute questionnaire built around varied task types, with clear section breaks and a logical flow, will produce meaningfully better response quality than a 10-minute questionnaire stacked with back-to-back grid questions and two open ends in the final third. The first questionnaire feels shorter to the respondent. The second one exhausts engagement before the most important questions are reached.
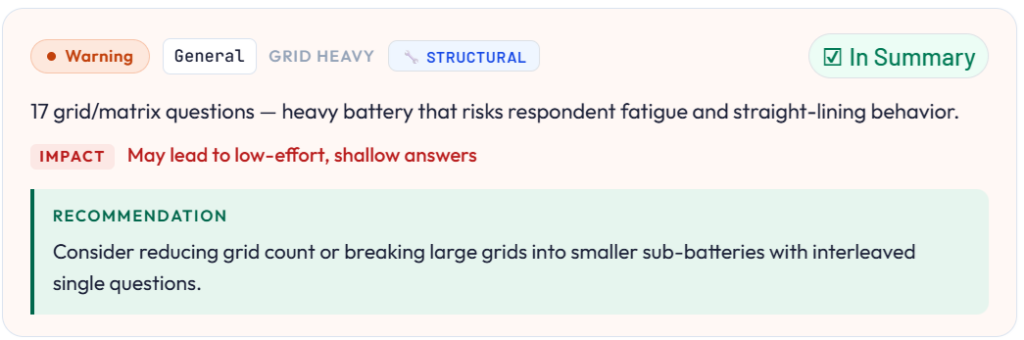
- Grid questions are the biggest single structural contributor to fatigue. They present multiple sub-items at once, require the respondent to hold a rating scale in mind while reading each row, and offer no change of pace. Two or three consecutive grids in the same section produce different response patterns by the final grid than the first. Scale-use narrows. Central-tendency responses increase. Respondents begin selecting the same answer across all rows without reading the individual items. And on mobile, where grids require horizontal scrolling or awkward tap navigation, respondents often abandon or default to the first available option rather than engage with each row individually.
- Open-ended questions placed late in a long questionnaire show the same pattern. By question 28, a respondent who has been rating attributes across multiple grids will provide a one-word verbatim where the same question at Q8 might have produced a sentence or two. The placement of the open end shaped its quality as much as the wording did.
- Repetitive question blocks compound the effect. Where similar structures appear across multiple sections without variation, respondents begin applying heuristic answers rather than considered ones. This is not dishonesty. It is the rational response to a questionnaire that has exhausted their engagement before asking its most important questions.
None of this is visible when someone reads the questionnaire as a document. It is only visible when the questionnaire is experienced as a survey.
Where Survey Abandonment Happens and Why Design Teams Miss It
The research team that builds a questionnaire does not experience it the way a respondent does. They know the content and understand why each grid exists and what it will contribute to the analysis. Also, they look at the questionnaire on a desktop, in a single sitting, with full context for every question.
A respondent meets the same questionnaire on a phone, eight minutes in, after clicking through a consent screen and three screener questions. They have no stake in the research objective and cannot see why Q14 through Q19 all need separate grid rows. Respondents are not invested in the findings. Their engagement is finite, and the questionnaire was designed without that constraint being applied explicitly.
This is not a competence failure on the part of the research team. It is a structural one: the people best placed to design the questionnaire are the least well placed to experience it the way a respondent will. The decisions that produce a burdensome survey feel reasonable during design. The six-row attribute grid made sense when the research team was building it. It only becomes a survey abandonment risk when a respondent encounters it for the first time, at the end of a long task sequence, on a small screen.
Survey abandonment at a particular question does not announce itself during design. It shows up in the data, after fieldwork has closed, in a completion curve that drops at a point nobody watched carefully enough. The project record shows the survey was fielded and closed within timeline. The analysis shows that a section of questions nobody questioned produced responses that do not hold up.
What Survey Abandonment Costs When It Shows up Late
The cost of a respondent experience problem follows the same pattern as other pre-programming errors. The later it surfaces, the more it costs to address, and the less it can be addressed at all.
Caught at the design stage, a burden problem is a restructuring decision. The team moves the open ends, splits a long grid into two shorter ones, removes a repeat block that was adding length without adding analytical value. These are document-level decisions. They take time, but they do not delay scripting or affect fieldwork.
Caught after programming, respondent experience problems require changes to a scripted survey. Every edit has to be re-checked against the surrounding logic, re-tested across the routing paths that touch the changed question, and in a multi-market study, retranslated and re-approved across every version. A restructuring decision that was a two-hour conversation at the design stage becomes a two-day revision cycle before the survey can go to field.
Caught in the data, a respondent burden problem cannot be recovered. The survey was in field. The completion curve dropped. The responses from the final third of the questionnaire came from respondents who were already giving mechanical answers rather than considered ones. The analysis reflects that. The client deliverable reflects that. And the conversation about why one segment is thin and why the key attribute ratings look flat in Q15 through Q19 is a conversation the team did not prepare for.
Survey abandonment that was predictable from the questionnaire design becomes a data quality footnote. That is the cost of catching it in the data rather than at the design stage.
What to Check in Your Questionnaire Before Scripting Begins
Four questions worth applying before any survey moves to programming.
- How many consecutive grids appear in a single section? More than two back-to-back grid questions is a signal worth examining. A six-row grid is not the same cognitive task as two three-row grids with a varied question in between. If your questionnaire has three or more consecutive grids anywhere, consider whether rows can be cut or whether the structure can be varied.
- What does the experience look like on mobile? Questionnaire designers typically read, and time surveys on desktop, where navigation and reading are faster. The same survey on mobile runs meaningfully longer in practice, and grid questions become a different task entirely when they require horizontal scrolling. If a significant share of your panel completes on mobile, your LOI estimate should reflect what the survey actually runs at on a phone.
- Where are the open ends placed? An open end in the first half of a questionnaire produces richer verbatims than the same question after a long grid sequence. If your most important qualitative question is sitting in the final third of a fatiguing questionnaire, it is in the wrong position.
- What does the longest respondent path actually look like? A questionnaire designed for the median path can have outlier paths that run significantly longer for respondents who qualify for multiple modules. Check the longest path explicitly, not just the average.
These checks take under an hour at the design stage. The survey abandonment problems they catch are only visible in the data after the budget has been spent.
How ResearchReady Reviews Respondent Experience Before Programming Begins
Research Ready’s Respondent Experience panel looks at the questionnaire from the direction the respondent will encounter it, not the direction the research team built it.
The panel checks for fatigue risk at the question and section level: where cognitive load is highest, where grid burden accumulates, where open-end placement creates a mismatch between question importance and respondent capacity. It checks readability in context, not just at the individual question level. This is where the distinction from language clarity review becomes concrete. A question that reads clearly in isolation may sit at the end of a section that has already worked through the respondent’s engagement. The language review catches the first problem. The Respondent Experience panel catches the second.
- It reviews completion risk: which points in the questionnaire represent the highest dropout probability based on structural signals.
- Flags mobile friction: grid structures, question formats, and navigation patterns that create barriers for respondents on a phone.
- Looks at tone across the questionnaire and at the overall respondent burden relative to the survey’s estimated LOI.
The output is a set of specific, located findings. Not a general note that the survey is long, but a flag at Q14 that the third consecutive grid in this section creates a measurable fatigue risk, with a recommendation to restructure or reduce before the questionnaire moves to scripting.
A survey that goes to scripting after a ResearchReady review has had its respondent journey assessed at the points where survey abandonment is most predictable. The problems that survive a structured pre-programming check tend to be the ones that cannot be anticipated in advance. The ones ResearchReady catches are the ones that should not have reached a programmer in the first place.
Wrap Up
A respondent who leaves at Q12 does not file a complaint. They show up in a completion curve, a thin segment, attribute ratings that don’t hold up against the screener data. By that point, the questionnaire is closed, and the only remaining question is how to account for the loss in the analysis.
Running a structured respondent experience review before scripting does not prevent every dropout. It prevents the ones that were predictable from the design. That is the one point in the project where the fix is still a document edit.
See how Research Ready’s Respondent Experience panel reviews your questionnaire before programming begins. Request a demo
Understand all five validation areas ResearchReady covers. Read the Survey Validation Checklist