You are two days into fieldwork and completion rates are running below the LOI estimate. The conversation goes to panel quality, incentive level, whether the screener was tight enough. Someone pulls the supplier into the review. Nobody goes back to look at question 23, a six-item grid that most respondents are answering on mobile. That question was in the brief when the sample budget was built.
This is a known pattern for how respondent experience problems that play out in quantitative research. They are diagnosed in fieldwork. They are caused in questionnaire design. The gap between those two moments is where the cost raises. By the time the drop-out rate shows, the project has already absorbed most of it.
The structural factors that shape respondent experience are not invisible. They are checkable. The reason most teams miss them is not that the checks are difficult. The checks happen informally, by people who already know the subject matter, at a stage when the questionnaire is considered ready. That combination produces a consistent blind spot, and fieldwork data is the feedback mechanism that exposes it.
Where Respondent Experience Problems Start
A questionnaire review before programming is standard practice. What it typically covers is content: question wording, scale logic, the brief objectives. What it does not typically cover in any systematic way is how the questionnaire feels to someone who does not know why the questions are being asked, is answering on a device the design team did not optimise for, and has no stake in completing every question carefully.
That is the respondent. Every question in a survey makes a demand on the person answering it. Some questions take two seconds. Others make a respondent stop, re-read, and work out what they are actually being asked. Add in the wrong question type on the wrong device, and a survey that looked fine on screen starts to feel like a chore by question twelve. All of that is a design problem, not a fieldwork problem.
Teams that review questionnaires before programming tend to catch content errors. They rarely have a consistent method for reviewing risks.
Five Factors That Shape Respondent Experience
Survey drop-out is not random. Research into questionnaire design consistently points to a set of structural factors that predict where and why respondents leave. Understanding these factors is the starting point for a proper pre-programming respondent experience review.
Survey Length and Fatigue
The first is survey length and fatigue. Benchmark data from Survicate, analyzing over 8,000 surveys, shows that survey completion rates drop significantly as length increases, with the largest single decline occurring when surveys move from two to three questions to four to six questions. Longer surveys do not just collect fewer responses. They collect weaker responses, because respondents who stay become less attentive as the survey continues. The problem is not length in itself. Most LOI estimates are built before anyone has checked whether the questionnaire is structured in a way that makes the time feel reasonable to a respondent who did not commission the study.
Cognitive Load
The second is cognitive load. Some questions are genuinely hard to answer — not because the topic is sensitive, but because the question itself asks a lot. Research in the International Journal of Market Research found that how much mental effort each question demands affects completion and data quality more than the total number of questions asked. Category jargon, multi-part tasks, instructions that assume knowledge the respondent does not have — each one adds a small cost. By question thirty, that cost has compounded. Respondents do not flag this friction. They abandon or give random answers.
Grid Burden
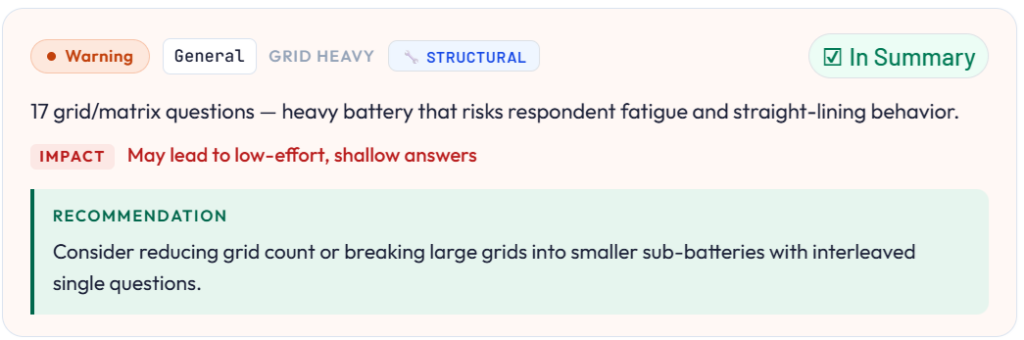
The third is grid burden. Grid questions are a standard tool in quantitative research, but they carry a specific cost to respondent experience that most pre-programming reviews do not assess. An experiment run by YouGov’s methodology team found that standard grid formats produced significantly higher item non-response than dynamic (item-by-item) alternatives, and that increasing the number of grid items from six to twelve significantly degraded scale reliability across the board. The issue compounds on mobile, where a grid that occupies a comfortable portion of a desktop screen becomes a scrolling task that respondents frequently abandon mid-way.
Open-end Burden
The fourth is the open-end burden. Open-ended questions place a qualitatively different demand on respondents than closed questions. A single well-placed open end is manageable. Multiple open ends in the same survey, or an open end positioned after a long closed section, significantly increases the cognitive and time cost for respondents. When that cost is not accounted for in the LOI estimate or the respondent experience review, it becomes a fieldwork surprise.
Mobile Friction
The fifth is mobile friction. Most questionnaires get built on a laptop and reviewed on a laptop. The people signing off on them scroll through at desktop speed, on a screen where a six-row grid fits comfortably in one view. More than half of the respondents who eventually take that survey will open it on a phone. According to data cited by Zamplia from Qualtrics, mobile now accounts for the majority of online survey completions. The screen assumptions the questionnaire was built on do not transfer.
What Grid Questions Cost on Mobile
It is worth spending a moment on grids specifically because they appear in almost every quantitative study and carry disproportionate risk to respondent experience.
A grid on desktop shows all rows and all scale points in a single view. A respondent reads the instruction, scans the rows, and works through the scale without leaving the visual frame. The same grid on mobile requires a respondent to scroll the rows while trying to hold the scale points in view, or to scroll the scale while holding the row labels. Neither experience matches the question design intent.
The result is not just drop-out. Respondents who stay and complete a mobile grid do so under meaningfully different conditions than desktop respondents, which affects data quality at the analysis stage. Straight-lining (where respondents select the same scale point across every row to end the task quickly) increases on mobile grids. The data comes back. It just does not mean what the researcher intended it to mean.
Pre-programming respondent experience reviews that include a mobile friction check flag grids before they become fieldwork problems. A grid that needs to stay in the survey can be reformatted. A grid that can be simplified often should be and a review before programming is the point at which that conversation can happen without a cost to the timeline.
Why Your LOI Estimate Is Built on Unreviewed Assumptions
Every sample budget is built on an LOI estimate. That estimate determines the cost per complete, the number of completes required given an assumed incidence rate, and the supplier conversation that sets fieldwork expectations.
The LOI estimate is usually based on a read-through of the questionnaire by someone who knows the subject matter well, on a device that is probably not mobile, under none of the conditions that fieldwork respondents actually face. It misses many of the factors that affect completion time, including question complexity, mobile usage, and variation in open-end responses.
When those factors are not reviewed before programming, the LOI estimate is a projection built on assumptions nobody checked. The fieldwork comes in longer. The supplier raises the cost per complete. The sample budget needs to be revised. Or the team accepts a lower complete rate and the data yield falls short. None of these outcomes were inevitable. They were predictable from the questionnaire, if anyone had looked at it from the respondent’s perspective before scripting started.
What a Pre-Programming Respondent Experience Review Catches
ResearchReady’s Respondent Experience module reviews the questionnaire against the structural factors described above before it moves to programming. The review covers fatigue indicators, cognitive load signals, grid burden relative to screen size and device context, open-end placement and concentration, and mobile friction points. The output maps findings to the specific questions where risk is highest, with recommendations attached to each one.
The practical consequence for Research Directors is that the LOI estimate their team takes into the sample conversation is grounded in a questionnaire that has been checked from the respondent’s point of view. The fieldwork surprises that used to surface two days in (the completion rates, the mobile drop-off, the longer-than-expected median response time) were caught at the stage where fixing them meant editing a document, not rebuilding a scripted survey.
ResearchReady works as part of the full CodexMR platform and as a standalone tool. Teams that want to start with pre-programming validation without adopting the full platform can run the Respondent Experience review independently. The questionnaire goes in, the review runs, and the output comes back as a structured findings report.
Wrap Up
The completion rate your study returns is not a function of panel quality alone. It reflects every design decision made in the questionnaire: the length, the question types, the cognitive demands, the device assumptions built into the layout. Those decisions are made before programming. The feedback on whether they were good decisions comes back from fieldwork, weeks later, when the options for responding to it are expensive.
A pre-programming respondent experience review moves that feedback loop forward. The issues that would have surfaced in fieldwork data get surfaced in a structured report, at the point in the project where acting on them costs almost nothing.
If you want to understand how the Respondent Experience module fits into your team’s current workflow, see what Research Ready covers across all seven review areas, or read how pre-programming validation reduces rework across the full questionnaire in our survey validation checklist article.